
Approach to Cost Modelling
In this case study, we will build an aggregated forecast taking multiple market indices such as raw materials, labor, utility, machinery used in manufacturing operations, and then identify % breakdown of how each cost index contributed to the overall aggregated trend.
BPS-AI
2/27/20243 min read

Project Benefit
Cost modelling is a crucial process for businesses to determine and analyze the expenses associated with their operations. It involves creating mathematical representations that depict the various factors affecting costs, such as production inputs, overhead expenses, and labor. By utilizing cost modelling techniques, companies can gain insights into their cost structure and make informed decisions to optimize their resources, improve efficiency, and maximize profitability. This approach allows organizations to forecast future expenses, evaluate different cost scenarios, and identify potential cost-saving opportunities. Moreover, cost modelling enables businesses to understand the cost drivers and allocate resources effectively, ensuring that they are investing in the right areas. With accurate cost modelling, companies can make strategic choices that align with their financial goals and drive sustainable growth.
Modelling Approach
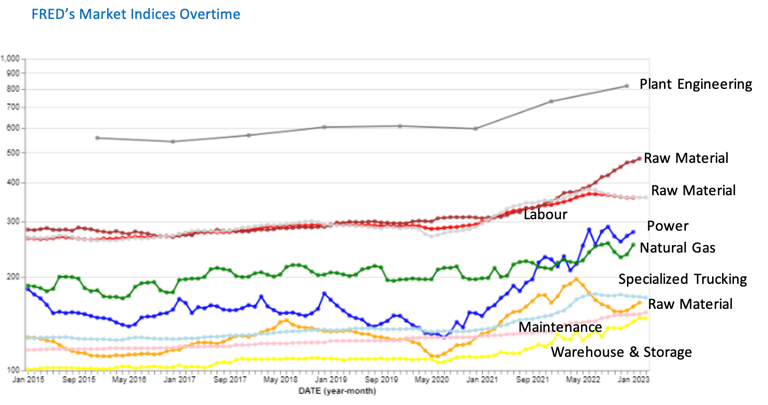
To start with an example, let's build a cost model to analyze cost of manufacturing "common salt a.k.a NaCl" we use everyday. We will look at the US market where it's manufactured and use FRED's (Federal Reserve Economic Data) to keep track of local indices such as raw materials, labor, utilities, plant engineering, specialized trucking, storage and maintenance. It is by no means the complete list that goes in to the manufacturing process, and may also include other costs such as overhead, profits, technical sales, research & development excluded from this study. By selecting specialized trucking and storage, we ensure product integrity & safe handling until it reaches the end customer.
Surely, the above chart looks busy, but it helps us tie-in the relationship between various market indices in-play. For instance power and natural gas, there was a point in time when salt manufacturers using industrial power paid more in utilities than natural gas. So, if you had an option, and if this trend continues long-term, may be re-assessing your supplier base to lower utility costs by switching to hybrid-renewable utility sources will be worth it. Similarly, significant uptrend and downtrend in the raw material spot prices, may suggest delaying or fast tracking supplier negotiations, to drive benefit from market changes. There could be many more insights, we can get just by plotting data series together.
Developing Aggregated Trend
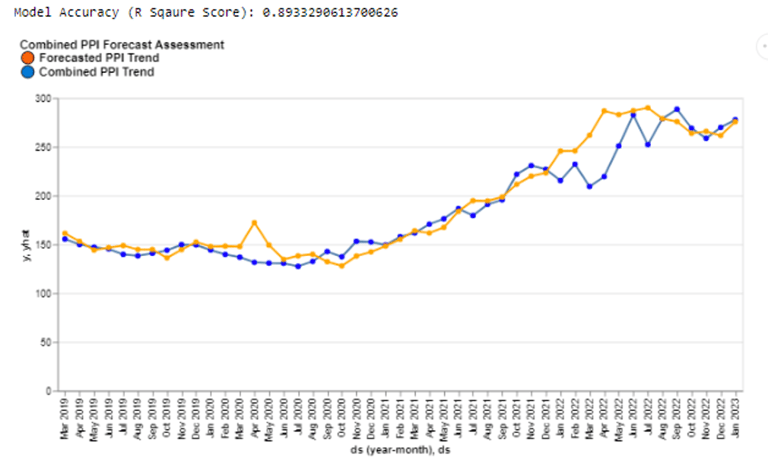
Now that we know which data series to track, after some data-preprocessing, we will train a machine learning model (blue line) and build an aggregated forecast (orange line) by combining market indices together and then estimate % breakdown contributed by each in developing the overall trend. This is useful because it can tell us which cost index has dominating trend that could trigger cost increase in future and by what percentage points. We should thoroughly investigate outliers in the trend to deeply understand model strengths and gap, to know limitations.
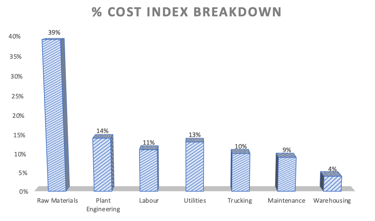
From the model above, even though we observe trained and forecasted model tags along well with 89.3% accuracy but then it's equally important to also know why we are losing remaining 10.7% and due to which datapoints. Next, the embedded bar chart, which shows % breakdown of raw materials contributing 39% of the total cost (as highest cost driver), means majority of cost increases in this trend will be dominated by raw materials. Another interesting observation, was that labor wages at 11% was found to be lower than the utility costs at 13%, which might suggest that companies who participated in FRED's survey are probably using more plant machinery (may be automated) to optimize their labor costs. So, it would be worth asking the question and learning more about your supplier's operations to estimate their man to machine ratio (MMR). Furthermore, we would also need to assess manufacturing overhead trends, depreciation decay on machinery, profits to improve % breakdown of total system cost structure.
Finally, once we are satisfied with our modelling observations, we will use the aggregated forecast (orange line) to build a short term and long term prediction to see how well our trained model is able to track market changes and uncover patterns that supplier-buyer organizations might be using to develop pricing and justify adjustments to compete in the market.
*Disclaimer: Views expressed in this article are based on a mathematical forecasting model derived using FRED's data series solely, and is subject to change with additional information.


Contact us
Whether you have a request, a query, or want to work with us, use the form below to get in touch with our team.
Business Priority Services Inc.
Calgary, Alberta
info@bps-ai.com
© 2026 Business Priority Services Inc. All rights reserved.
Access market signals, cost intelligence insights, and procurement-focused updates from BPS.