
Forex CAD/USD Forecast
In this case study, we will look at Forex (CAD/USD) forecast between 2024 to 2026 to try identify optimal timing for Canadian Producers to source goods and services from the US market that help put a full stop to contract hedging (i.e. profiting from forex fluctuations during the contractual term) and save unnecessary costs.
BPS-AI
2/17/20242 min read

Forex Market Sentiments Published in Feb 2024
The CAD/USD forecast for the forex market suggests that the Canadian dollar (CAD) is expected to strengthen against the US dollar (USD) in the coming weeks. This prediction is based on various factors, including the current economic conditions in Canada, the monetary policy decisions of the Bank of Canada, and the overall market sentiment towards the US dollar. It is anticipated that the CAD will benefit from the recovering Canadian economy, supported by rising commodity prices and increased demand for Canadian exports. Additionally, the USD is facing some headwinds due to the uncertainty surrounding the US economic recovery and the Federal Reserve's cautious approach towards interest rate hikes. However, it is important to note that forex forecasts are subject to various market dynamics and can change rapidly, so companies should closely monitor the market conditions and adjust their strategies accordingly.
Forecasting Model in Real-Time
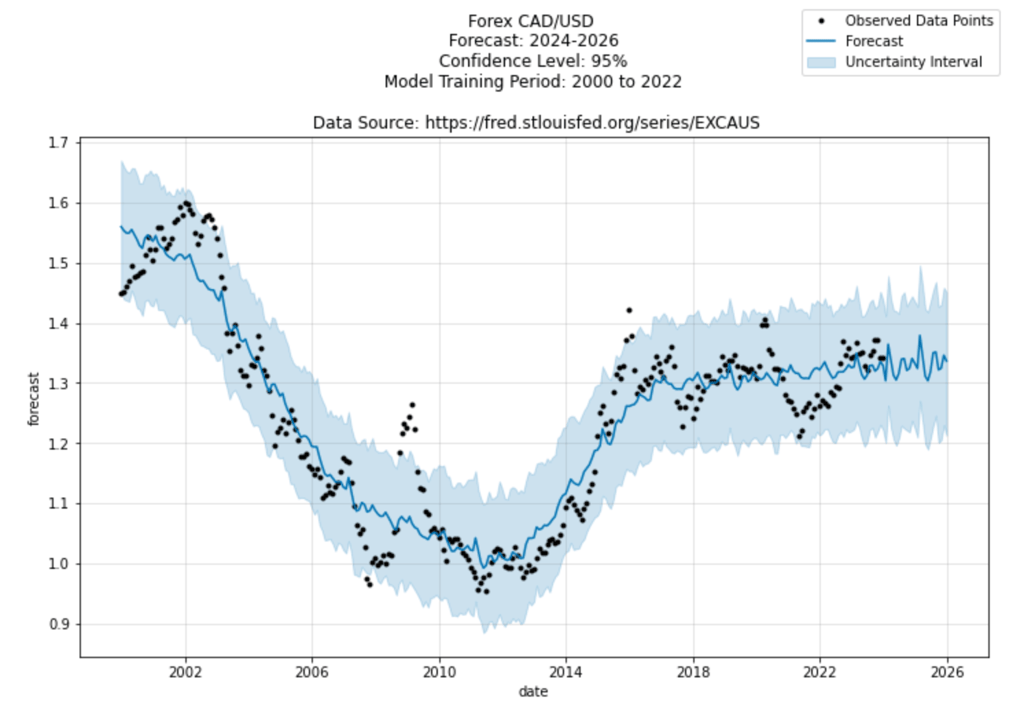
However, as per the forex model shown in the figure, CAD to USD is expected to trend side-ways with a slight bumps along the way between 2024 to 2026. The average trend represented by the blue line shall remain above 1.3 CAD but likely below 1.4 CAD against a US dollar.
To gain confidence in this model, it was trained on a public data series taken from FRED's (Federal Reserve Economic Data) between 2000 to 2022, and validated on 2023 to develop a 2-year forecast with 95% confidence interval. The reason for selecting longer training period was to help data model learn from hidden patterns and use it to make predictions. The black dots in the graph represents actual training points while the light blue shaded beam represents model uncertainty because no model is 100% accurate. You will also notice that there are some sections in the graph, where black dots aligns very closely with the blue line indicating how well our model was able to learn and predict forex conversions in those time periods while other datapoints mostly within the projected line of path.
So, now the question arises how do we use this model. Simply put, when you are considering buying goods and services from US markets, there is a 95% chance that the predictive forex value will fall on the blue line or within the shaded region indicating continuation of the existing market conditions, and not an outlier (like the ones occurred in 2009 and 2015) suggesting need to pulse check market again. May be this process can be baked into your contracting strategy, helping your organization and your valued suppliers gain visibility of what to expect in the coming months and reconcile forex unsettled balances at the end of the contracting term.
Above cycle can be iterated as often as required to capture significant market shifts in the existing trend line. By re-running mathematical model, we can predict forex trends with calculated certainty and make business decisions quickly to manage unforeseen risks.
**Disclaimer: Views expressed in this article are based on a mathematical forecasting model derived using FRED's data series solely, and is subject to change with additional information.


Contact us
Whether you have a request, a query, or want to work with us, use the form below to get in touch with our team.
Business Priority Services Inc.
Calgary, Alberta
info@bps-ai.com
© 2026 Business Priority Services Inc. All rights reserved.
Access market signals, cost intelligence insights, and procurement-focused updates from BPS.